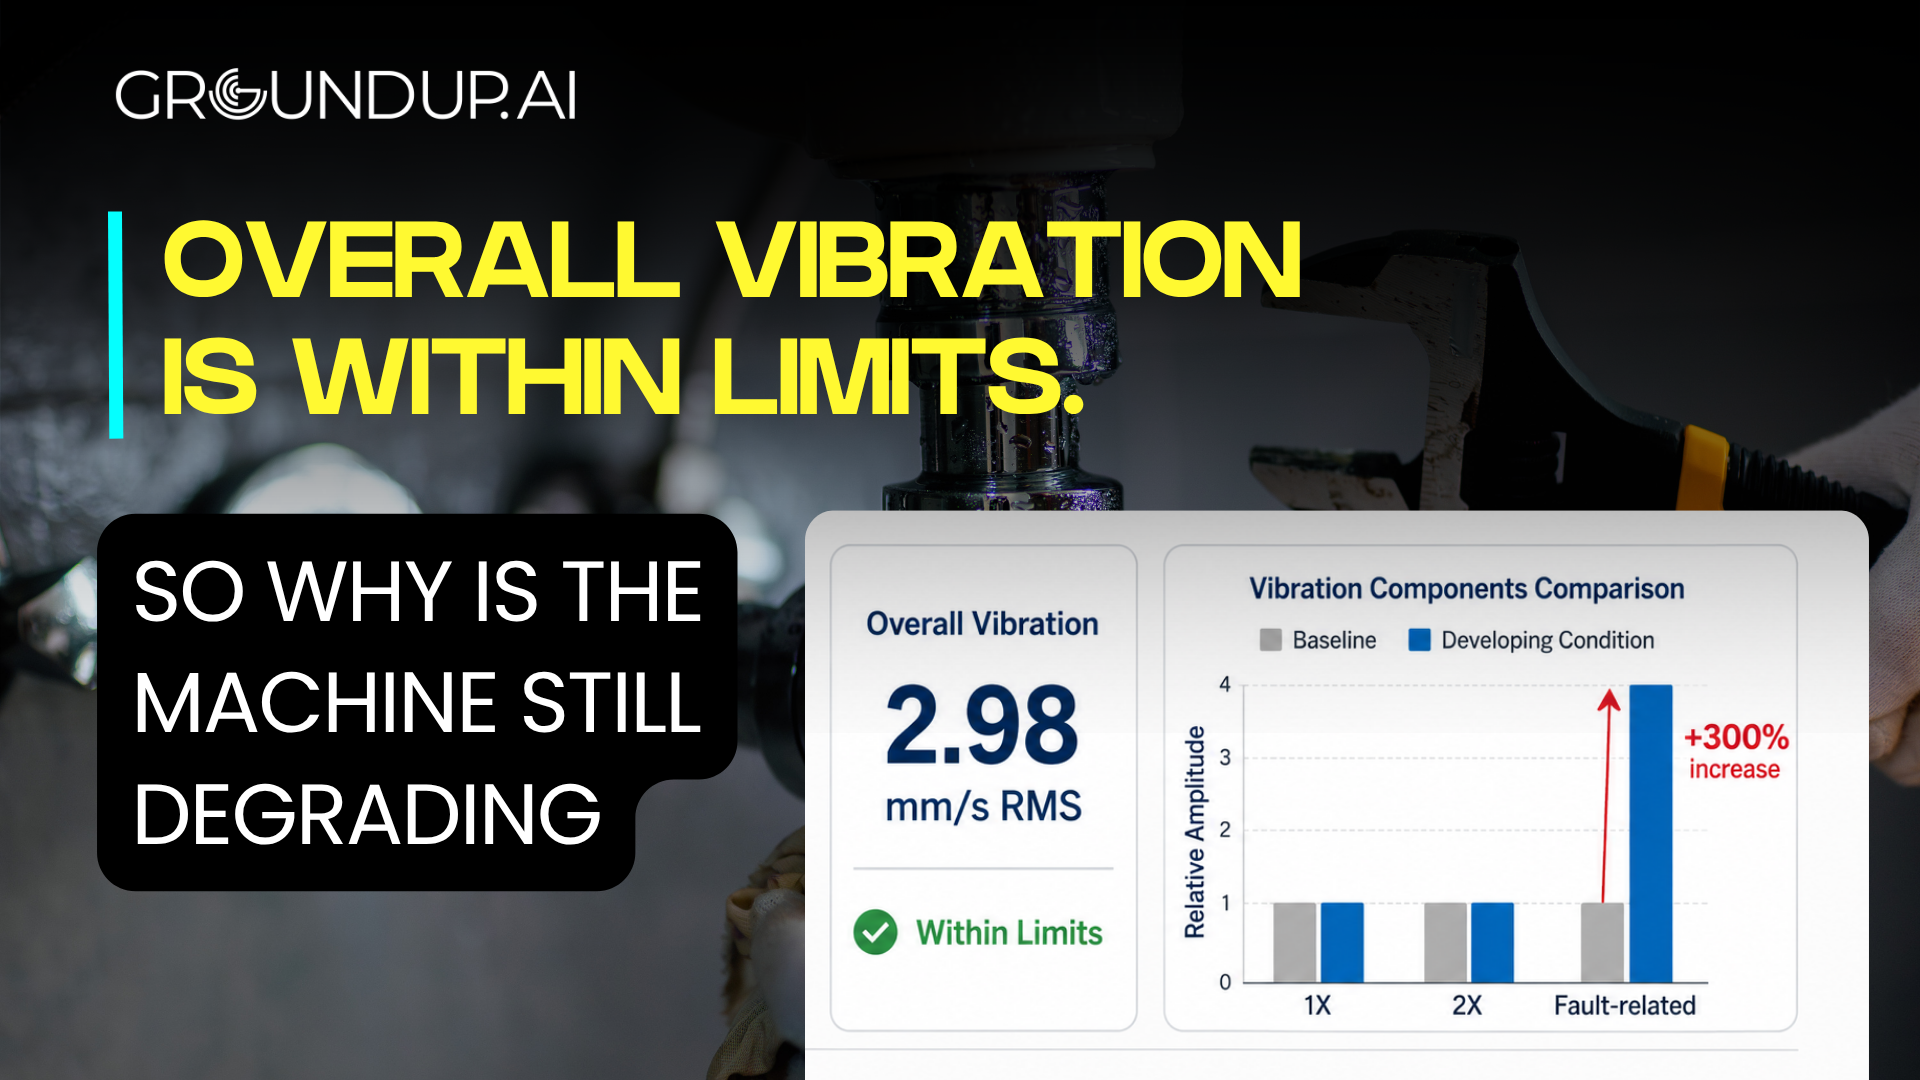
Can a Machine Be Degrading Even When Overall Vibration Is Within Limits?
Yes. A machine can develop a mechanical condition while its overall vibration remains below a configured alarm or severity limit. Broadband RMS combines vibration energy across a defined measurement band into one value, while early degradation may first appear only at specific frequencies, in higher-frequency impact behaviour, at one sensor location, in one measurement direction or under one operating state.
This means:
Overall vibration within limits
does not necessarily mean:
Every diagnostic feature is unchanged.
A conventional broadband threshold and a detailed vibration diagnosis answer different engineering questions.
This distinction matters in conditions involving:
- Rolling-element bearings
- Misalignment
- Mechanical looseness
- Gearboxes
- Couplings
- Localised structural changes
- Speed-dependent vibration
- Process-dependent machine behaviour
Fluke notes that overall vibration is useful as a general machine-health indicator but has limitations, including that certain bearing faults may not strongly influence the overall value until significant damage has developed.
What Is Overall Vibration?
Overall vibration is a single value representing vibration magnitude across a defined measurement bandwidth.
Depending on the monitoring method, the value may be expressed as:
- Velocity RMS
- Acceleration RMS
- Displacement
- Peak
- Peak-to-peak
- Other calculated indicators
For many rotating machines, overall velocity RMS provides a practical way to assess general mechanical severity.
It allows maintenance teams to answer questions such as:
Has vibration reached an operational alarm level?
Is machine-level vibration trending upward?
Which asset in a fleet deserves further investigation?
That simplicity is valuable.
But simplicity comes with information loss.
Overall RMS does not retain information about where in frequency the vibration energy exists.
Why Can a Fault Increase 4× While Overall RMS Barely Changes?
The RMS value of a sampled signal is:
xRMS=1N∑n=1Nxn2x_{RMS}=\sqrt{\frac{1}{N}\sum_{n=1}^{N}x_n^2}
For a simplified set of independent sinusoidal components, total RMS can be approximated as:
Voverall≈V12+V22+V32+⋯+Vn2V_{overall}\approx\sqrt{V_1^2+V_2^2+V_3^2+\cdots+V_n^2}
Consider three dominant components:
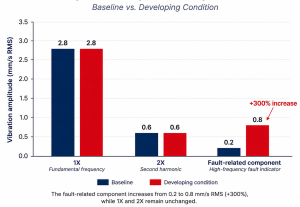
The baseline total is approximately:
2.82+0.62+0.22=2.87 mm/s RMS\sqrt{2.8^2+0.6^2+0.2^2} = 2.87\text{ mm/s RMS}
After the fault-related component grows:
2.82+0.62+0.82=2.98 mm/s RMS\sqrt{2.8^2+0.6^2+0.8^2} = 2.98\text{ mm/s RMS}
The diagnostic component has become four times larger.
The overall RMS has increased by only approximately 3.7%.
A conventional alarm may therefore remain untriggered even though one part of the vibration spectrum has changed dramatically.
Important Technical Note
This is a simplified educational example.
Real vibration signals contain:
- Many spectral components
- Broadband noise
- Structural resonances
- Finite acquisition windows
- Leakage
- Instrument filtering
- Process vibration
However, the root-sum-square principle demonstrates why narrowband changes and broadband changes do not necessarily occur at the same percentage rate.
What Does Parseval’s Theorem Tell Us About Vibration?
Parseval’s theorem connects signal energy in the time domain with signal energy in the frequency domain.
Conceptually:
The vibration energy observed in the waveform is represented by energy distributed across the spectrum.
But the distribution can be highly uneven.
A machine may have a dominant 1X rotational component containing a large proportion of the measured vibration energy.
A smaller fault-related component can increase several hundred percent and still remain small relative to that dominant component.
As a result:
Broadband RMS may change slightly.
while:
The diagnostic significance of one spectral region changes considerably.
This is why severity and diagnosis should not be treated as interchangeable concepts.
What Is the Difference Between Overall Vibration and FFT Analysis?
Overall vibration combines vibration magnitude into one broadband number. FFT analysis separates the vibration waveform into frequency components so engineers can see where the vibration energy is located.
The measured time-domain waveform can be represented as:
x(t)x(t)
The Fast Fourier Transform converts the sampled signal into a frequency-domain representation:
X(f)X(f)
The spectrum can reveal features associated with:
- 1X shaft speed
- 2X and higher harmonics
- Bearing-related frequencies
- Gear-mesh frequencies
- Modulation sidebands
- Structural resonances
- Broadband noise
Fluke distinguishes the two approaches directly: overall vibration produces a single general-health value, while spectrum analysis uses an FFT to identify individual frequency components that can support fault diagnosis.
Can the FFT Change While Overall Vibration Remains Within Limits?
Yes.
Consider:
Overall velocity: 2.9 mm/s RMS
One month later:
Overall velocity: 3.0 mm/s RMS
The broadband change is small.
However, the spectrum could simultaneously show:
1X: stable
2X: +70%
Specific narrowband component: +200%
New sidebands: present
High-frequency impact energy: increasing
The overall value and FFT are both correct.
The FFT simply preserves information that the broadband value has compressed.
Why Is “Within Limits” Different From “Normal for This Machine”?
Consider an asset with:
Configured alarm: 7.0 mm/s RMS
Historical operating range:
2.0–2.4 mm/s RMS
Current trend:
2.1 → 2.6 → 3.1 → 3.7 → 4.3 mm/s RMS
The alarm has not been crossed.
The vibration level is technically still within the configured limit.
But the asset has changed substantially relative to its historical behaviour.
ISO 20816-1 evaluates machinery using both vibration magnitude and change in vibration magnitude, showing why an absolute limit and a change-from-baseline criterion are different concepts.
For industrial machinery covered by ISO 20816-3, the guidance likewise considers both steady-running vibration values and changes in those values.
The engineering questions are therefore different:
Threshold Question
Has the vibration reached a defined severity level?
Baseline Question
Has the asset moved away from its established behaviour?
A robust condition-monitoring strategy needs both perspectives.
Why Can Early Bearing Damage Be Missed by Broadband Velocity?
Early rolling-element bearing defects can generate repetitive, high-frequency impacts that contribute relatively little to broadband velocity RMS.
When a rolling element passes over a localised defect:
- A mechanical impact occurs.
- The impact excites a structural resonance in the bearing/housing system.
- The response may occur at relatively high frequencies.
- The event repeats according to bearing kinematics.
- Repetitive impact behaviour becomes diagnostically useful before total vibration severity necessarily becomes high.
SKF explains that bearing-related signals can be hidden beneath higher-amplitude vibration caused by conditions such as imbalance and misalignment; its enveloping technique uses band-pass filtering and demodulation to enhance the repetitive impact sequence.
This creates a technically valid situation where:
Broadband velocity remains within limit
while:
Bearing-related envelope features increase.
Why Are Acceleration and Velocity Different?
For sinusoidal motion:
V=A2πfV=\frac{A}{2\pi f}
where:
- VV = velocity amplitude
- AA = acceleration amplitude
- ff = frequency
For the same acceleration amplitude, velocity amplitude becomes smaller as frequency rises.
This has practical consequences.
Lower-Frequency Mechanical Conditions
Features such as rotational vibration, imbalance and some misalignment behaviour may be clearly visible in velocity.
Higher-Frequency Impact Behaviour
Bearing impacts and some gearbox conditions can excite higher-frequency resonances and may become more obvious in acceleration.
A high-frequency diagnostic signal can therefore increase strongly without producing an equivalent increase in velocity RMS.
Velocity vs Acceleration vs Enveloped Acceleration
Velocity
Commonly useful for:
- Overall machinery severity
- Rotational vibration
- Imbalance
- Misalignment
- Looseness
- Lower-frequency mechanical conditions
Acceleration
Provides stronger sensitivity to:
- High-frequency vibration
- Mechanical impacts
- Gear excitation
- Bearing/housing resonances
Enveloped Acceleration
Designed to expose repetitive modulation associated with impulsive conditions such as:
- Rolling-element bearing defects
- Gear defects
- Lubrication-related impact behaviour in certain applications
SKF notes that acceleration-enveloping values can provide indicators of conditions including mechanical looseness, lubrication problems and bearing defects, although alarm levels remain machine- and application-dependent.
How Does Envelope Analysis Work?
Envelope analysis isolates repetitive impact modulation from a selected higher-frequency vibration region.
A typical process includes:
1. Acquire Raw Acceleration
The sensor measures the machine’s acceleration waveform.
2. Select a Resonance Band
A band-pass filter is applied around a frequency region where impacts excite structural resonance.
The goal is to reduce unrelated low-frequency vibration.
3. Demodulate the Signal
The amplitude envelope of the filtered resonance is extracted.
Implementations can use rectification/filtering or analytical-signal techniques such as the Hilbert transform.
4. Calculate an Envelope FFT
The envelope is transformed into the frequency domain.
The analyst can then examine the repetition frequencies of the impacts.
SKF describes its enveloping method as a demodulation process using band-pass filtering to reduce structural vibration and highlight periodic pulses associated with bearing damage.
What Are BPFO, BPFI, BSF and FTF?
Rolling-element bearing geometry generates characteristic repetition frequencies.
BPFO — Ball Pass Frequency Outer Race
The rate at which rolling elements pass a fixed defect on the outer race.
BPFI — Ball Pass Frequency Inner Race
The rate at which rolling elements interact with an inner-race defect.
BSF — Ball Spin Frequency
Associated with rotation of individual rolling elements.
FTF — Fundamental Train Frequency
Associated with cage rotational behaviour.
These frequencies depend on:
- Shaft speed
- Number of rolling elements
- Ball or roller diameter
- Bearing pitch diameter
- Contact angle
In real vibration analysis, engineers rarely rely on one isolated peak.
They may also examine:
- Harmonics
- Sidebands
- Trend evolution
- Modulation
- Time waveform
- Changes with load and speed
Why Are Sidebands Important?
Suppose a vibration component is modulated by another periodic process.
A frequency-domain pattern can appear around a carrier:
fc−fm,fc,fc+fmf_c-f_m,\quad f_c,\quad f_c+f_m
where:
- fcf_c = carrier frequency
- fmf_m = modulation frequency
The carrier itself may not increase dramatically.
But the sidebands can grow.
This can be significant in:
- Gearbox analysis
- Motor analysis
- Bearing modulation
- Load-related mechanical behaviour
Again:
Overall vibration may barely move.
The spectral structure can change substantially.
What Is Narrowband Trending?
Narrowband trending monitors selected frequency ranges independently rather than combining the entire measurement band into one value.
A monitoring system could trend:
- 1X
- 2X
- 3X
- Bearing-related bands
- Gear mesh
- Gear-mesh sidebands
- Structural resonances
- Selected shaft orders
Example:
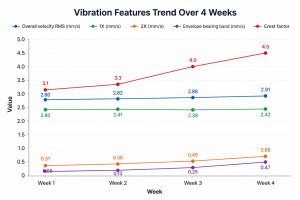
Illustrative values only.
Broadband RMS increased by less than 4%.
The envelope feature increased almost six times.
This is exactly the type of information a single overall value can hide.
Can Crest Factor Change Before RMS?
Crest factor is:
CF=xpeakxRMSCF=\frac{x_{peak}}{x_{RMS}}
If isolated impacts begin increasing peak amplitude while RMS remains stable, crest factor may rise.
This can make crest factor useful for detecting changes in waveform impulsiveness.
However, it should not be treated as a linear fault-severity measure.
As degradation develops:
- Impacts may become more frequent.
- RMS may begin increasing.
- Peak-to-RMS relationships can change.
Crest factor may therefore plateau or fall even while the mechanical condition becomes more severe.
It must be interpreted in context.
What Does Vibration Kurtosis Tell Us?
Kurtosis measures characteristics related to the tails of a signal’s amplitude distribution.
Impulsive vibration can increase kurtosis.
This can make it useful for identifying changes in waveform behaviour.
But high kurtosis is not fault-specific.
It can also be influenced by:
- Process impacts
- Startup
- Electrical interference
- External shocks
- Loose sensor mounting
- Transient operations
A high kurtosis result should therefore be treated as:
Evidence of changed waveform statistics
rather than:
Automatic confirmation of a bearing defect.
Can an FFT Miss a Fault?
Yes, if the measurement or analysis configuration is unsuitable.
Having an FFT does not guarantee adequate diagnostic visibility.
Frequency Resolution
FFT spacing is approximately:
Δf=fsN\Delta f=\frac{f_s}{N}
where:
- fsf_s is sampling frequency
- NN is sample count
A short acquisition can produce insufficient resolution to distinguish closely spaced frequencies.
Spectral Leakage
If the acquisition does not contain an integer number of signal cycles, energy can spread across adjacent FFT bins.
Windowing can reduce leakage, but different window functions affect amplitude accuracy and spectral resolution differently.
Sampling Rate
The sampling rate determines the measurable frequency range.
The acquisition chain also requires appropriate anti-aliasing.
Sensor Bandwidth
A vibration sensor must have adequate mechanical and electrical frequency response for the feature being measured.
Sensor Mounting
Stud, adhesive, magnetic and handheld mounting methods can produce different high-frequency measurement responses.
The higher the diagnostic frequency of interest, the more important the mechanical transmission path can become.
So:
Collecting vibration data
is not automatically equivalent to:
collecting diagnostically useful vibration data.
What Is Order Analysis?
Order analysis represents vibration frequency relative to shaft rotational speed.
For example:
At 1,200 RPM:
1X=20 Hz1X=20\text{ Hz}
At 1,800 RPM:
1X=30 Hz1X=30\text{ Hz}
In a fixed-frequency spectrum, the rotational component moves from 20 to 30 Hz.
In an order representation:
1st order remains 1st order.
Similarly:
2X = 2nd order
3X = 3rd order
This is particularly useful for variable-speed machines.
Without RPM context, a normal shift in machine speed can look like a moving spectral anomaly.
Why Can Changing RPM Cause Spectral Smearing?
If machine speed changes significantly while data is being acquired, a rotational component does not remain at one frequency.
Instead of producing one sharp FFT line, its energy can spread across multiple bins.
Techniques such as synchronous resampling or tachometer-referenced order tracking can help align vibration features to shaft rotational position.
This is why:
Frequency
without:
speed context
can be misleading on variable-speed assets.
Why Does Operating State Matter?
Machine vibration is affected by operating condition.
Relevant variables can include:
- RPM
- Load
- Flow
- Pressure
- Temperature
- Production state
- Valve position
- Startup
- Shutdown
Consider the same pump at:
40% process load
and:
100% process load
Different vibration signatures may be entirely normal.
So the more meaningful comparison may be:
Current full-load vibration versus historical full-load vibration
rather than:
Current vibration versus one static baseline.
What Is an Operating-State-Specific Machine Baseline?
A technically useful baseline can include context such as:
Asset
Sensor location
Measurement axis
RPM range
Load range
Operating mode
Measurement configuration
For example:
Pump A, drive-end radial sensor, 1,480–1,520 RPM, high-load production state
provides significantly more diagnostic context than:
Pump A normal vibration
The objective is to compare mechanically equivalent conditions.
Is an ISO Vibration Limit the Same as a Machine Baseline?
No.
They answer different questions.
An operational or severity limit asks:
Has vibration reached a defined level?
A historical machine baseline asks:
Has this asset changed relative to its reproducible normal behaviour?
ISO 20816-1 includes both vibration magnitude and changes in vibration magnitude among its general evaluation criteria.
For certain industrial machinery, ISO 20816-3 similarly evaluates both steady-running vibration values and changes to those values.
A machine can therefore remain below an absolute limit while still showing a significant change relative to itself.
Does the Overall Vibration Frequency Band Matter?
Yes.
An overall vibration value represents only the vibration contained within the measurement bandwidth used to calculate it.
“Overall” does not mean:
Every vibration frequency generated by the machine.
Suppose velocity RMS is calculated over a defined low-to-mid-frequency band.
A bearing defect produces resonance at several kilohertz.
Depending on the sensor and measurement architecture, that high-frequency energy may be:
Strong in acceleration
but:
Weak in velocity
or:
Outside the displayed overall metric’s frequency band.
When interpreting overall vibration, engineers should understand:
- Sensor bandwidth
- Sampling rate
- Filter settings
- Measurement bandwidth
- Integration method
- RMS method
- Units
- Acquisition duration
The measurement definition matters as much as the numerical value.
Why Does Sensor Location Matter?
A machine does not vibrate uniformly.
Mechanical vibration travels through:
- Bearings
- Housings
- Shafts
- Frames
- Foundations
A developing pump drive-end bearing condition may appear strongly at:
Pump DE radial
while remaining weak at:
Motor NDE
A single machine-level severity value can lose that localisation.
Sensor-level analysis allows maintenance teams to ask:
Where is the relative change strongest?
That is a much more useful diagnostic question.
Why Does Vibration Direction Matter?
Mechanical forces also act differently across measurement axes.
Typical measurements include:
- Horizontal
- Vertical
- Axial
Some alignment-related behaviour may produce stronger axial vibration.
Other conditions may appear mainly radially.
Structural stiffness can also make one measurement direction much more responsive than another.
A developing condition can therefore become obvious in one axis before it becomes significant in a machine-level overall measurement.
What Should Maintenance Check When Overall Vibration Remains Within Limits?
If broadband severity has not crossed its threshold but there is evidence that machine behaviour is changing, investigate progressively.
Review the Overall Trend
Has RMS changed relative to the machine’s historical behaviour?
Examine the FFT
Which frequencies have changed?
Trend Narrowband Features
Are 1X, 2X, bearing bands, gear mesh or specific orders increasing?
Inspect High-Frequency Acceleration
Are new impacts or resonances appearing?
Review Envelope Analysis
Are repetitive impact frequencies, harmonics or sidebands developing?
Examine the Time Waveform
Are impacts, modulation or transients visible?
Review Crest Factor and Kurtosis
Has waveform impulsiveness changed?
Compare Sensor Locations
Where is the relative change largest?
Compare Measurement Directions
Is the change axial, horizontal or vertical?
Check RPM
Could the spectral movement be explained by machine speed?
Check Load and Process State
Are equivalent operating conditions being compared?
Confirm Measurement Configuration
Does the acquisition bandwidth include the diagnostic signal of interest?
This is how condition monitoring moves from:
one severity number
to:
a mechanical investigation.
What Is the Difference Between a Severity Indicator and a Diagnostic Indicator?
A severity indicator describes how large the machine’s vibration has become. A diagnostic indicator helps explain what type of mechanical behaviour may be producing the change.
Examples of severity-related information include:
- Broadband velocity RMS
- Absolute vibration magnitude
- Operational alarm limits
Diagnostic features may include:
- Running-speed orders
- Harmonics
- Sidebands
- Bearing-envelope frequencies
- Narrowband energy
- Resonances
- Time-waveform impacts
- Phase relationships
- Statistical features
A machine can therefore have:
Broadband severity within limits
while:
Diagnostic evidence of degradation is increasing.
That does not mean broadband vibration monitoring has failed.
It means a severity metric should not be expected to perform a complete diagnostic function.
How Can AI-Based Condition Monitoring Help?
AI-based condition monitoring can evaluate combinations of machine behaviour rather than relying on one absolute threshold.
Depending on the measurement architecture, relevant information can include:
- Overall RMS
- Spectral amplitudes
- Frequency-band energy
- Harmonics
- Orders
- Envelope features
- Time-domain statistics
- Rate of change
- Sensor location
- Measurement direction
- Operating state
- Machine-specific baseline
- Other available condition signals
The more useful questions become:
What changed?
Where did it change?
Under what operating condition?
How unusual is it for this asset?
Which mechanical conditions are consistent with the pattern?
What should maintenance inspect?
This is the difference between simply detecting that a threshold was exceeded and interpreting how the machine itself is changing.
How Does This Relate to Groundup.ai Cognitive Maintenance?
Groundup.ai’s Cognitive Maintenance approach is based on moving beyond a single threshold or single condition indicator.
The objective is not simply to generate:
High vibration = alarm.
It is to provide more diagnostic context around changing machine behaviour.
A condition can therefore be investigated based on questions such as:
What changed in the machine signal?
Where did the change appear?
Is the behaviour unusual relative to the asset’s baseline?
Did operating conditions change?
Do multiple condition signals support the same mechanical interpretation?
What should the maintenance team inspect next?
Overall vibration remains useful.
The value comes from understanding what is happening underneath the overall number.
Frequently Asked Questions
Can a bearing be degrading while overall vibration remains within limits?
Yes. Early rolling-element bearing damage can generate small high-frequency impacts that may not initially contribute enough energy to materially increase broadband velocity RMS. Envelope analysis can help expose repetitive impact behaviour that is otherwise masked by stronger machine vibration.
Why is my FFT changing when overall vibration is not?
A particular spectral component can increase substantially while still representing a small proportion of total broadband vibration energy. The FFT preserves frequency-specific information that an overall RMS value compresses into one number.
Does an overall vibration value below an alarm limit mean the machine is healthy?
Not necessarily.
It means the measured overall vibration has not crossed that defined limit.
Machine health may also require consideration of:
- Changes relative to baseline
- Frequency-specific behaviour
- Sensor location
- Measurement direction
- High-frequency impacts
- Operating condition
ISO 20816-1 includes both vibration magnitude and change in magnitude as evaluation criteria.
What is the difference between overall velocity and FFT?
Overall velocity provides a single broadband vibration magnitude.
FFT analysis separates the measured vibration into frequency components, allowing analysts to investigate which parts of the spectrum are changing.
Why are bearing defects easier to see in acceleration?
Bearing impacts often excite higher-frequency structural resonances. Because velocity amplitude decreases relative to acceleration as frequency increases, a high-frequency impact can be prominent in acceleration while contributing relatively little to velocity.
What is bearing envelope analysis?
Bearing envelope analysis filters a selected high-frequency resonance region, extracts its amplitude modulation and analyses that modulation for repetitive fault-related frequencies.
What does BPFO mean?
BPFO means Ball Pass Frequency Outer Race.
It represents the characteristic repetition frequency associated with rolling elements passing an outer-race defect.
What does BPFI mean?
BPFI means Ball Pass Frequency Inner Race.
It represents the characteristic repetition frequency associated with rolling elements interacting with an inner-race defect.
What is narrowband vibration trending?
Narrowband trending monitors individual frequency ranges or features independently rather than combining all measured vibration energy into a single broadband number.
Why is order analysis useful?
Order analysis expresses vibration relative to rotational speed. It helps track shaft-related features on variable-speed machines because 1X remains first order even when its frequency in Hz changes.
What does vibration crest factor measure?
Crest factor is peak amplitude divided by RMS amplitude. It can indicate increasing waveform impulsiveness but should not be treated as a standalone fault-severity measure.
Can vibration remain below an ISO guideline and still be changing abnormally?
Yes.
ISO machinery-vibration guidance considers not only absolute vibration magnitude but also changes in vibration magnitude.
The Technical Takeaway
A machine can simultaneously show:
Overall vibration within its configured limit
and:
Meaningful diagnostic evidence of degradation.
That is possible because broadband RMS combines vibration energy.
It does not retain all of the information about:
- Where that energy occurs in frequency
- Which sensor detected it
- Which measurement direction changed
- Whether impacts are becoming more impulsive
- Whether a specific order is increasing
- Whether sidebands are developing
- Whether the operating condition changed
- Whether the machine has departed from its own historical baseline
Early degradation may first appear through:
- Narrowband spectral growth
- Running-speed harmonics
- Modulation sidebands
- High-frequency acceleration
- Bearing envelope frequencies
- Crest factor or kurtosis changes
- Order-domain behaviour
- Localised sensor changes
- Operating-state-specific baseline deviations
Only later may enough energy accumulate for broadband RMS itself to rise substantially.
So the engineering question should not stop at:
“Is overall vibration within limits?”
It should continue with:
“What is changing inside the machine signal before the overall limit is crossed?”
That is where condition monitoring becomes more than a severity check.
It becomes a tool for understanding machine behaviour and directing maintenance investigation.
Groundup.ai’s Cognitive Maintenance is built on these same principles. Rather than relying on a single vibration threshold, it looks at how machine behaviour changes across signal features, historical baselines and operating conditions, helping maintenance teams understand what changed, what the pattern may indicate and where to investigate next.