Most operators know downtime is expensive. Very few know exactly how expensive, for their operation, their assets, their sector.
That gap between this is costly and this costs us $X per hour, $Y per year is where most maintenance investment decisions go wrong. Budgets get set against benchmarks. ROI cases get built on industry averages. And the number that finally gets approved is someone else’s number applied to your problem.
What Is the True Cost of Unplanned Downtime in Industrial Operations?
Unplanned downtime costs vary significantly across sectors, but the order of magnitude is consistently larger than organisations expect when they calculate it for the first time.
In Manufacturing, a single unplanned stoppage on a critical production line can range from $10,000 to over $250,000 per hour, depending on throughput, product margin, and downstream cascading effects. In Maritime, an unplanned engine failure mid-voyage carries not just repair costs but port delay penalties, cargo liability, and reputational consequences with charter clients. In Critical Infrastructure (e.g. utilities, water treatment, airports) downtime carries regulatory and public safety dimensions that no benchmark can adequately capture.
The point is not the number. The point is that the number is almost always larger than the estimate: and the estimate is almost always what decisions get made on.
Why Generic ROI Benchmarks Fail Industrial Organisations
Industry benchmarks for downtime costs serve one purpose: to make the category of the problem legible. They are not a basis for investment decisions.
A benchmark figure, say, “$260,000 per hour for automotive manufacturing”, is a composite of hundreds of facilities, asset configurations, production volumes, and cost structures. Applying it to a single FMCG line in Southeast Asia, or a chiller plant in the Middle East, or a fleet of vessels operating on spot charter rates, produces a number that is directionally interesting and operationally useless.
The questions that actually matter are:
- How many hours of unplanned downtime does this specific asset class generate per year?
- What is the loaded cost per hour, including labour, lost throughput, emergency parts, and knock-on delays?
- What proportion of that is preventable with earlier, more accurate fault detection?
- At what investment level does prevention cost less than the downtime it eliminates?
These are not questions benchmarks answer. They are questions YOUR OWN DATA answers, if you know where to look, and how to structure the calculation.
What Is Cognitive Maintenance ROI, and How Is It Different from Predictive Maintenance ROI?
Predictive maintenance (PdM) ROI calculations are straightforward in theory: reduce unplanned downtime hours, multiply by cost per hour, and subtract the cost of the PdM system. The problem is that PdM ROI calculations routinely underperform their projections because the human-in-the-loop bottleneck isn’t accounted for.
A predictive system flags a bearing anomaly. A human reviews the alert. A work order is raised. A technician is dispatched. Parts are sourced. The intervention happens sometimes within hours, sometimes within days, depending on shift structure, parts availability, and how many other alerts are competing for attention. The prediction was accurate. The response was slow. The downtime was partially prevented, not eliminated.
Cognitive Maintenance ROI is calculated differently because the system works differently.
Cognitive Maintenance doesn’t just predict. It diagnoses. It identifies not only that a fault is developing, but which fault, what is causing it, and what the recommended intervention is.
The result is a compressed decision cycle: the alert arrives with the answer already attached. Response time drops. Intervention quality improves. And the proportion of predicted failures that are actually prevented, rather than merely anticipated, increases materially.
The ROI difference is structural.
How to Calculate Your Cognitive Maintenance ROI: The Key Variables
A credible ROI calculation for Cognitive Maintenance requires five inputs. None of them require estimation. All of them exist in your operational data.
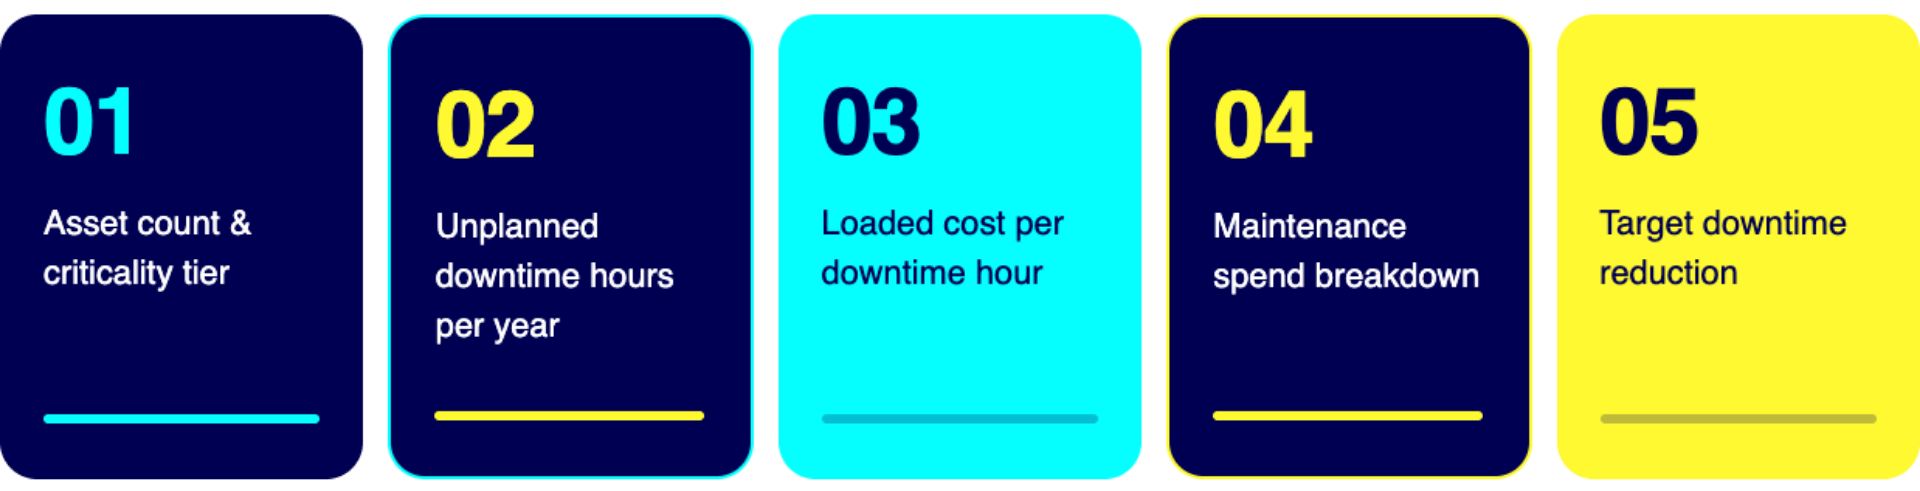
- Asset count and criticality tier How many assets are you monitoring, and what is the downtime consequence of failure for each? A critical pump on a primary production line has a different cost profile than an auxiliary system with redundancy. Segmenting by criticality tier produces a more accurate baseline than treating all assets equally.
- Current unplanned downtime hours per asset class per year This is the most important variable and the most frequently underreported. Many organisations track total downtime but do not cleanly separate planned maintenance from unplanned failure. The calculation requires unplanned hours specifically. This is the number that Cognitive Maintenance directly addresses.
- Loaded cost per downtime hour Loaded cost includes lost throughput at margin (not revenue), emergency labour premium, expedited parts costs, and downstream delay costs. For most industrial operations, the loaded cost is 2–4x the surface-level lost production figure most finance teams use.
- Current maintenance spend breakdown What proportion of maintenance spend is reactive, preventive, and condition-based? A higher reactive proportion indicates a higher opportunity for Cognitive Maintenance to shift spend from emergency response to planned intervention, which is cheaper per event and generates fewer secondary failures.
- Target downtime reduction Based on deployment data across Manufacturing, Maritime, and Critical infrastructure clients, Cognitive Maintenance typically delivers a 20–40% reduction in unplanned downtime hours within the first year of deployment. Conservative calculations should use 20%. Operations with high reactive maintenance ratios typically see outcomes at the upper end.
What Does a Cognitive Maintenance ROI Calculation Actually Look Like?
Consider a mid-sized Manufacturing facility with the following profile:
- 40 monitored assets across two critical production lines
- 180 hours of unplanned downtime per year across those assets
- Loaded cost per downtime hour: $18,000
- Current annual maintenance spend: $2.4M, of which approximately 35% is reactive
Baseline downtime cost: 180 hours × $18,000 = $3.24M per year
Cognitive Maintenance impact at 30% downtime reduction: 54 hours prevented × $18,000 = $972,000 in recovered value per year
Payback period: Typically under 12 months at this asset scale, depending on deployment scope and licensing structure.
This is not a projection built on benchmarks. It is a calculation built on the facility’s own numbers, which is exactly why it holds up in a boardroom conversation.
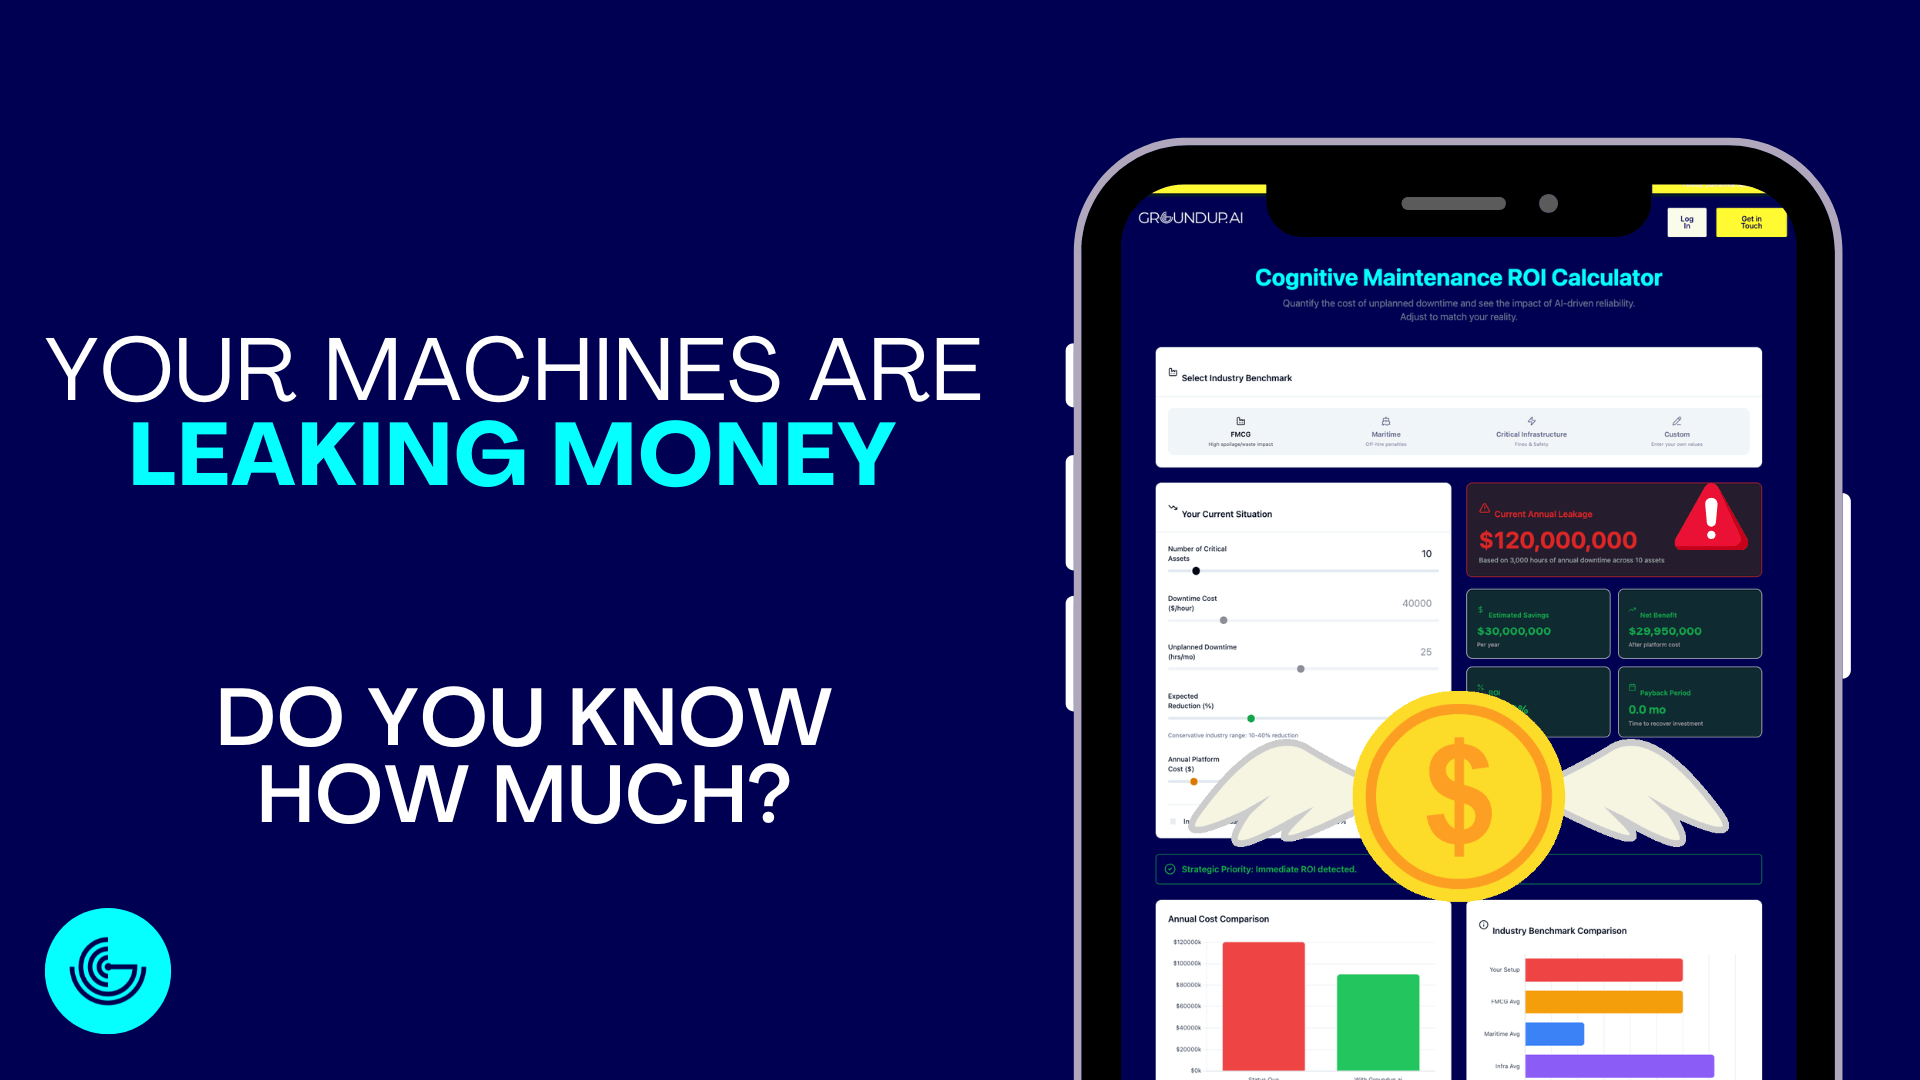
Try the Groundup.ai Cognitive Maintenance ROI Calculator

The Groundup.ai ROI Calculator is built to replace the benchmark conversation with your conversation.
Plug in your assets, your downtime cost per hour, your current unplanned hours, and see in real time what unplanned downtime is currently costing your operation, what Cognitive Maintenance saves, and how fast the investment pays back.
Your operation, your numbers. ⚡️
If the number surprises you, it should. Most operators who run the calculation for the first time find that the cost of inaction is significantly higher than the cost of deployment.
If you want a tailored assessment that goes beyond the calculator, accounting for your specific asset classes, maintenance maturity, and operational context, the Groundup.ai team is one conversation away.
Frequently Asked Questions: Cognitive Maintenance ROI
What is a realistic payback period for Cognitive Maintenance? For asset-heavy operations with significant unplanned downtime, payback periods of 6–18 months are common. Operations with higher loaded downtime costs and larger asset counts tend to see faster payback.
How does Cognitive Maintenance ROI compare to traditional predictive maintenance ROI? Cognitive Maintenance typically delivers superior ROI because it addresses both the prediction and the diagnosis, compressing the response cycle and increasing the proportion of predicted failures that are actually prevented rather than merely anticipated.
What data do I need to calculate my Cognitive Maintenance ROI? You need four inputs: critical asset count, unplanned downtime hours per month, cost per downtime hour, and current maintenance spend. All of these exist in operational and finance records for most industrial organisations.
Does Cognitive Maintenance require replacing existing systems? No. Groundup.ai’s approach is to integrate with existing data infrastructure, SCADA systems, operational logs, IoT sensors where present, and layer the cognitive intelligence on top. Our Datafy → Diagnose → Decide framework is designed to work with the data you already have.
How quickly can Cognitive Maintenance be deployed? Deployment timelines depend on asset complexity and data availability, but the transfer learning architecture means that baseline models can be operational in as little as two weeks, without requiring years of historical failure data.